The Nature of
Science

EdPuzzle Access
Use the embedded link below to access EdPuzzle. Follow these steps:
- Click the blue Edpuzzle logo in the top left corner of the page.
- Enter the class code in the Enter Code box beside the logo.
- Click Find Class, then click Join Open Class.
- Refresh your browser to gain access to all Edpuzzle videos for this course.
Class Code: ucaruji
Learning
Objectives
After completing this unit, you can apply the
scientific method to investigate natural phenomena, use the International
System of Units (SI) to measure physical quantities and create appropriate
tables and graphs to analyze and communicate data effectively. Additionally, you
will understand how the scientific method, SI system, and graphical
representations can help scientists make discoveries and better understand the
natural world.
The Method of
Science
The Amazing World of
Science
Science is like a magical key that unlocks the
mysteries of the world around us. It's a way to explore and understand daily
natural events. Science can be divided into three main areas: life science, which studies living
things; Earth science, which focuses
on our planet and its environment; and physical
science, which deals with matter and energy.

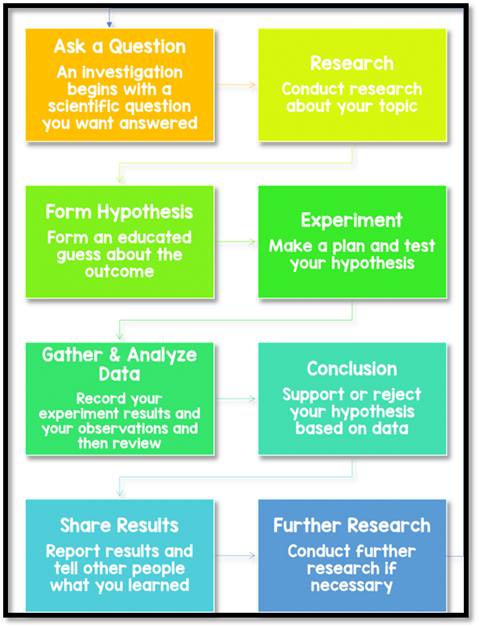
The Scientific Method:
A Step-by-Step Guide
When scientists want to learn more about
something, they follow a set of steps known as the scientific method. This method helps them organize their thoughts
and experiments to find answers to their questions.
1. Observing and Asking
Questions: It starts with curiosity and noticing something interesting.
Scientists observe their surroundings and ask questions about why or how
something happens.
2. Forming a Hypothesis: Scientists make an educated guess called a
hypothesis after asking a question. This is a prediction they can test to see
if it's true.
3. Designing and Conducting
an Experiment: Scientists create a well-planned experiment to test their
hypothesis. They make sure to have a control group for comparison and only
change one variable at a time. This helps them figure out what is causing the
results they see.
4. Analyzing Data and Drawing
Conclusions: Scientists look at the collected data after the experiment to
see if it supports their hypothesis. They use this information to draw
conclusions about what they've learned.
Click on the image
to complete an activity.
Theories and Laws:
Explaining the World Around Us
When scientists gather enough evidence from
their research, they propose scientific theories. A scientific theory is a well-tested explanation based on facts, not
just a guess. Think of it like a detective solving a mystery!
Sometimes, after many observations and
experiments, scientists discover patterns in nature that are always true. These
are called scientific laws. For
example, the law of gravity is a scientific law that explains why things fall
to the ground.

In conclusion, the scientific method is a
powerful tool that helps us understand the world around us. By asking
questions, forming hypotheses, conducting experiments, and analyzing data, we
can unlock the secrets of nature and make amazing discoveries. So, keep
exploring, young scientists, and let your curiosity lead the way!
Standards of
Measurement
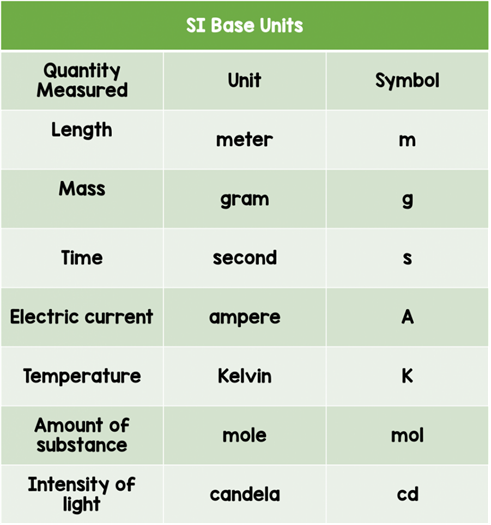
The International
System of Units (SI)
Imagine baking a cake with a recipe that uses
different measuring systems. It would need to be clarified. Scientists worldwide
use a single system of measurements called the International System of Units, or SI for short. SI units are based on the metric system, which is easy to use because it's organized around
multiples of ten. Each unit is ten times larger or smaller than the next one!
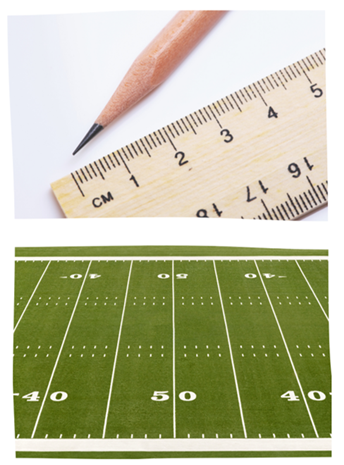
Measuring Length
Length is how we measure the
distance between two points. Depending on the object's size, scientists use
different units of measurement. For example, the length of a football field is
measured in meters, while a pencil is measured in centimeters. Using the right
units, we can easily compare and communicate the size of different objects.
Mass and Density
Mass is the amount of
matter in an object. Picture a bowling ball and a basketball: although they're
similar in size, they have more mass because they contain more matter.

Density is a property of an
object that we can find by considering its mass and volume. Volume is the
amount of space something takes up. Water displacement is one way to measure a
solid object's volume. When an object is placed in water, it pushes the water
out of the way or "displaces" it. The amount of water displaced is
equal to the object's volume. Once we know the mass and volume of an object, we
can calculate its density.

Keeping Track of Time
Time is the interval
between two events, and it helps us understand the world around us. We measure
time using devices like stopwatches and clocks. Time helps us organize our
days, keep appointments, and even follow the progress of scientific
experiments.

In conclusion, the International System of
Units (SI) makes it easy to understand and compare measurements in the world
around us. Using SI units to measure length, mass, density, and time, we can
accurately describe objects' properties and explore science's wonders. So, keep
measuring and discovering, young scientists!
Graphing
The Importance of
Recording Observations
Experiments are like treasure hunts; your
observations are the precious gems you discover. To make sense of your
findings, it's essential to record your observations and organize your data. One of the best ways to do this
is using tables and graphs. These visual displays help us
see patterns and make comparisons more easily.

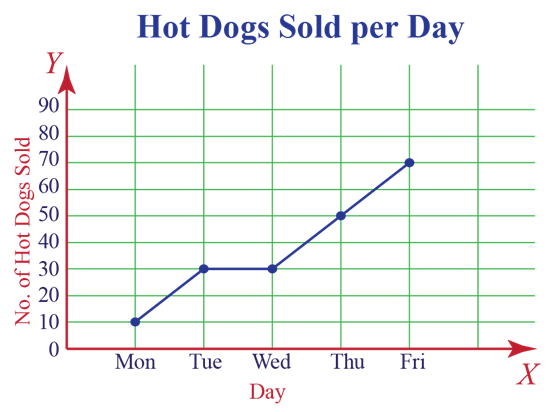
Line Graphs: Tracking
Changes Over Time
A line
graph is fantastic for showing how data changes over time. It looks like a
series of connected points representing different moments. For example, if you
wanted to know how many hot dogs were sold on Thursday at a school fair, you
could use a line graph to track the weekly sales. By looking at the line, you
can see if there was a spike in sales on Thursday compared to other days.
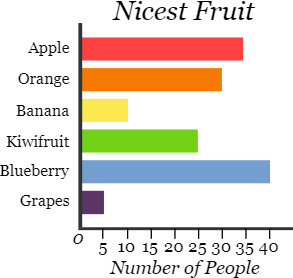
Bar Graphs: Comparing
Counted Data
Bar
graphs
are great for comparing information that you gather by counting. They display
data using vertical or horizontal bars, where the length or height of the bar
represents the quantity. For instance, if you surveyed your classmates about
their favorite fruits and found out that many liked grapes and bananas, you
could use a bar graph to show the total number of people who preferred each
fruit. You can see which fruit is more popular by looking at the bars.
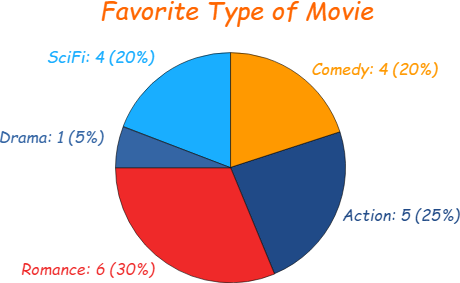
Circle Graphs: Breaking
Down a Whole into Parts
A circle
graph, a pie chart, is perfect for showing how a fixed quantity is divided
into parts. The circle represents the whole, and each "slice"
represents a percentage of that whole. If you wanted to find out what
percentage of people's favorite type of movie is drama, you could use a circle
graph to display the survey results. By looking at the size of the drama slice,
you can determine what proportion of people prefer drama movies compared to
other genres.
.
In conclusion, tables and graphs are powerful
tools for making sense of the data you collect during experiments. Line, bar,
and circle graphs have unique strengths in helping you visualize and understand
your observations. So, young scientists, keep exploring and remember to display
your data clearly to share your exciting discoveries with the world!